Introduction
A severe weather event along the Florida panhandle on January 9, 2024 brought 10 tornadoes (red circles) and many high wind reports (yellow circles) to the region. Several boats along the Florida Gulf coast were damaged by high winds and tornadoes during the event.

Doppler Weather Radar
Doppler Weather radar is the best resource for staying aware when severe thunderstorms are approaching. While National Weather Service (NWS) forecasters use a wide variety of radar data during an outbreak, reflectivity and velocity imagery figure prominently in the issuance of severe weather watches and warnings. Data from these products is used to identify potential downburst winds, waterspouts, and tornadoes. Thanks to the agency’s data sharing policies and the availability of high-quality radar apps, boaters can view the same imagery used by NWS forecasters on their phone or tablet.
Reflectivity Imagery
The most common and easily recognized radar product is reflectivity. Reflectivity imagery is very useful in assessing the overall size, intensity, motion, and evolution of a weather system. Reflectivity is the amount of energy — measured in dBZ — that is backscattered by a target. It is a measure of the precipitation rate (how hard it’s raining) and can vary dramatically based on the size, number, shape, and state (liquid or frozen) of targets. Values less than 20 dBZ indicate mist, dust, and other small particles. Extremely small particles, such as cloud droplets, are too small to be detected by NWS radar. Reflectivity values associated with rainfall range from 20 dBZ to 50 dBZ, depending on the number and size of the raindrops. Hail is typically present when dBZ values are greater than 55.
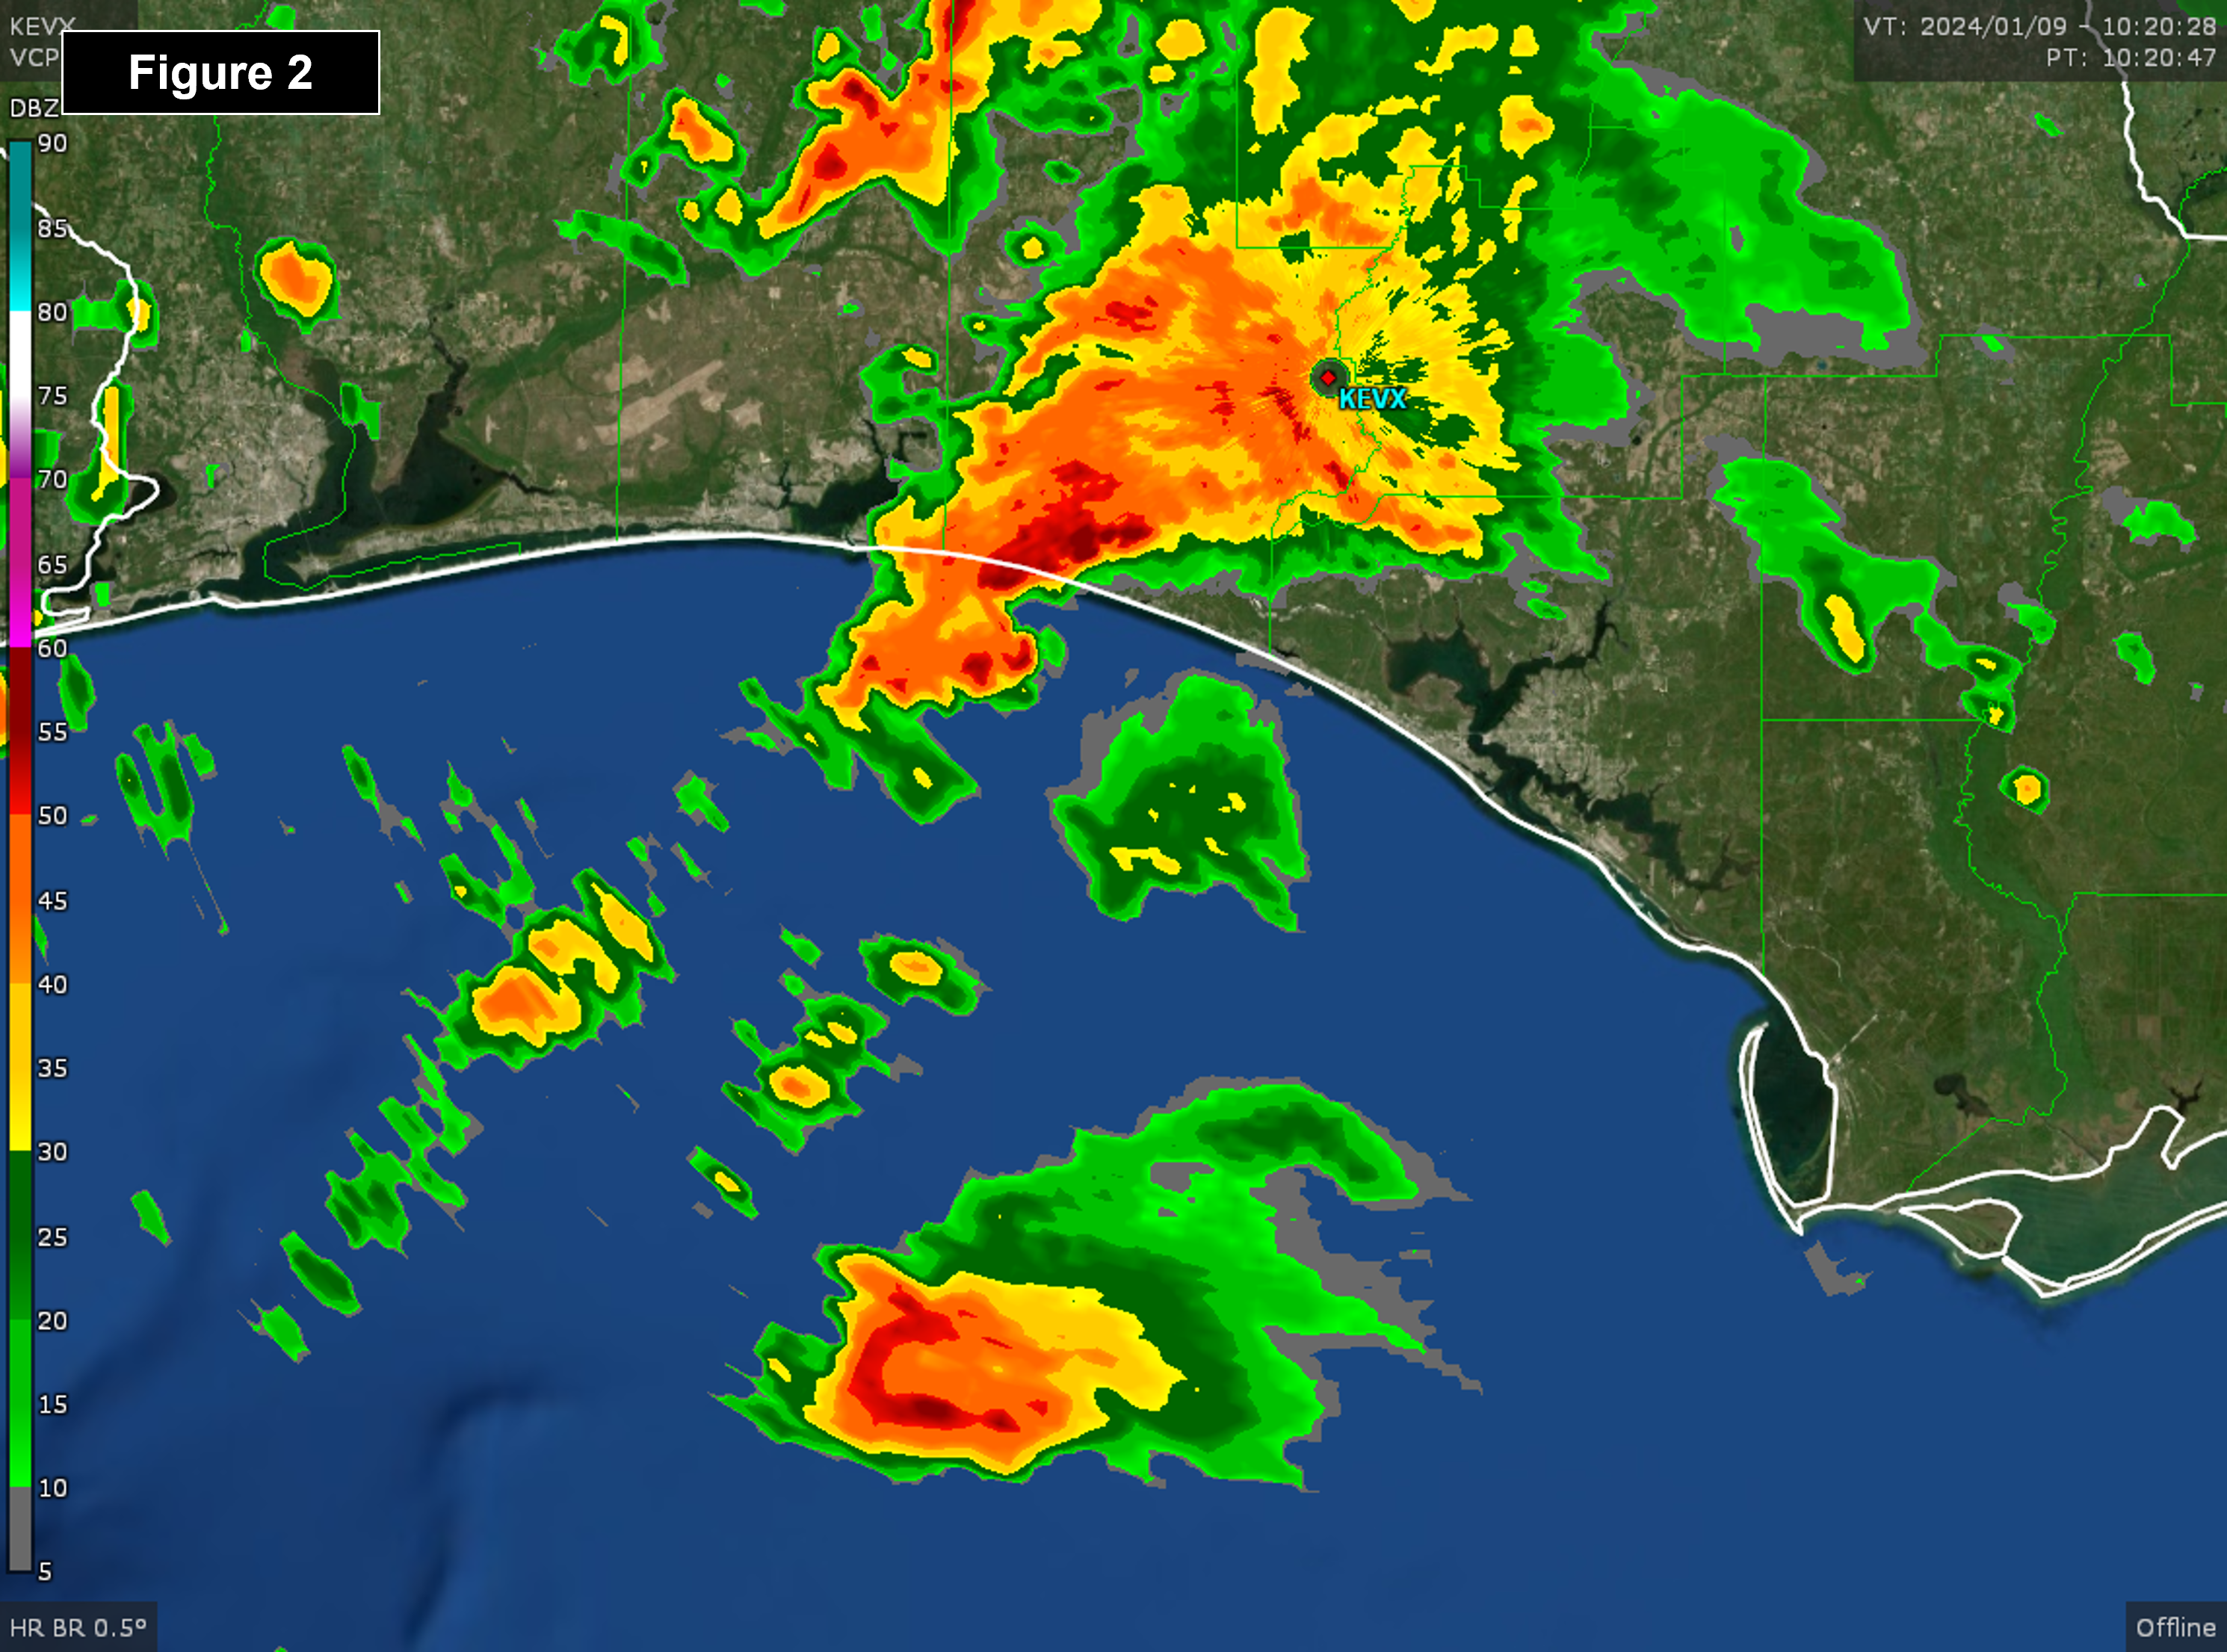 The base reflectivity image at 5:20 am on January 9, 2024 (figure 2) shows a large cluster of thunderstorms along the Gulf Coast and an intense thunderstorm approaching from the south. The areas shaded in light green indicate light rain, yellow shading indicates moderate rain, and the regions shaded in dark orange are areas of heavy rain. Those areas of dBZ values greater than 55 are shaded in dark red and are likely regions where the thunderstorm’s updraft is suspending hail. (Click here for an annotated image.)
Velocity Imagery
Velocity imagery displays the motion (both direction and speed) of the particles in a thunderstorm. Using data from the Doppler shift, velocity imagery displays the overall wind field relative to the radar station. The scale is in knots, with negative values indicating wind blowing toward the station (inbound) and positive values representing wind blowing away from the station (outbound). (Purple shading on velocity images indicates where the station was unable to determine the Doppler shift and therefore no velocity data is available.) Since it displays motion, velocity imagery is a great resource for determining how fast a thunderstorm is approaching. In addition, velocity imagery can provide an early warning of damaging downbursts, particularly close to the radar station.
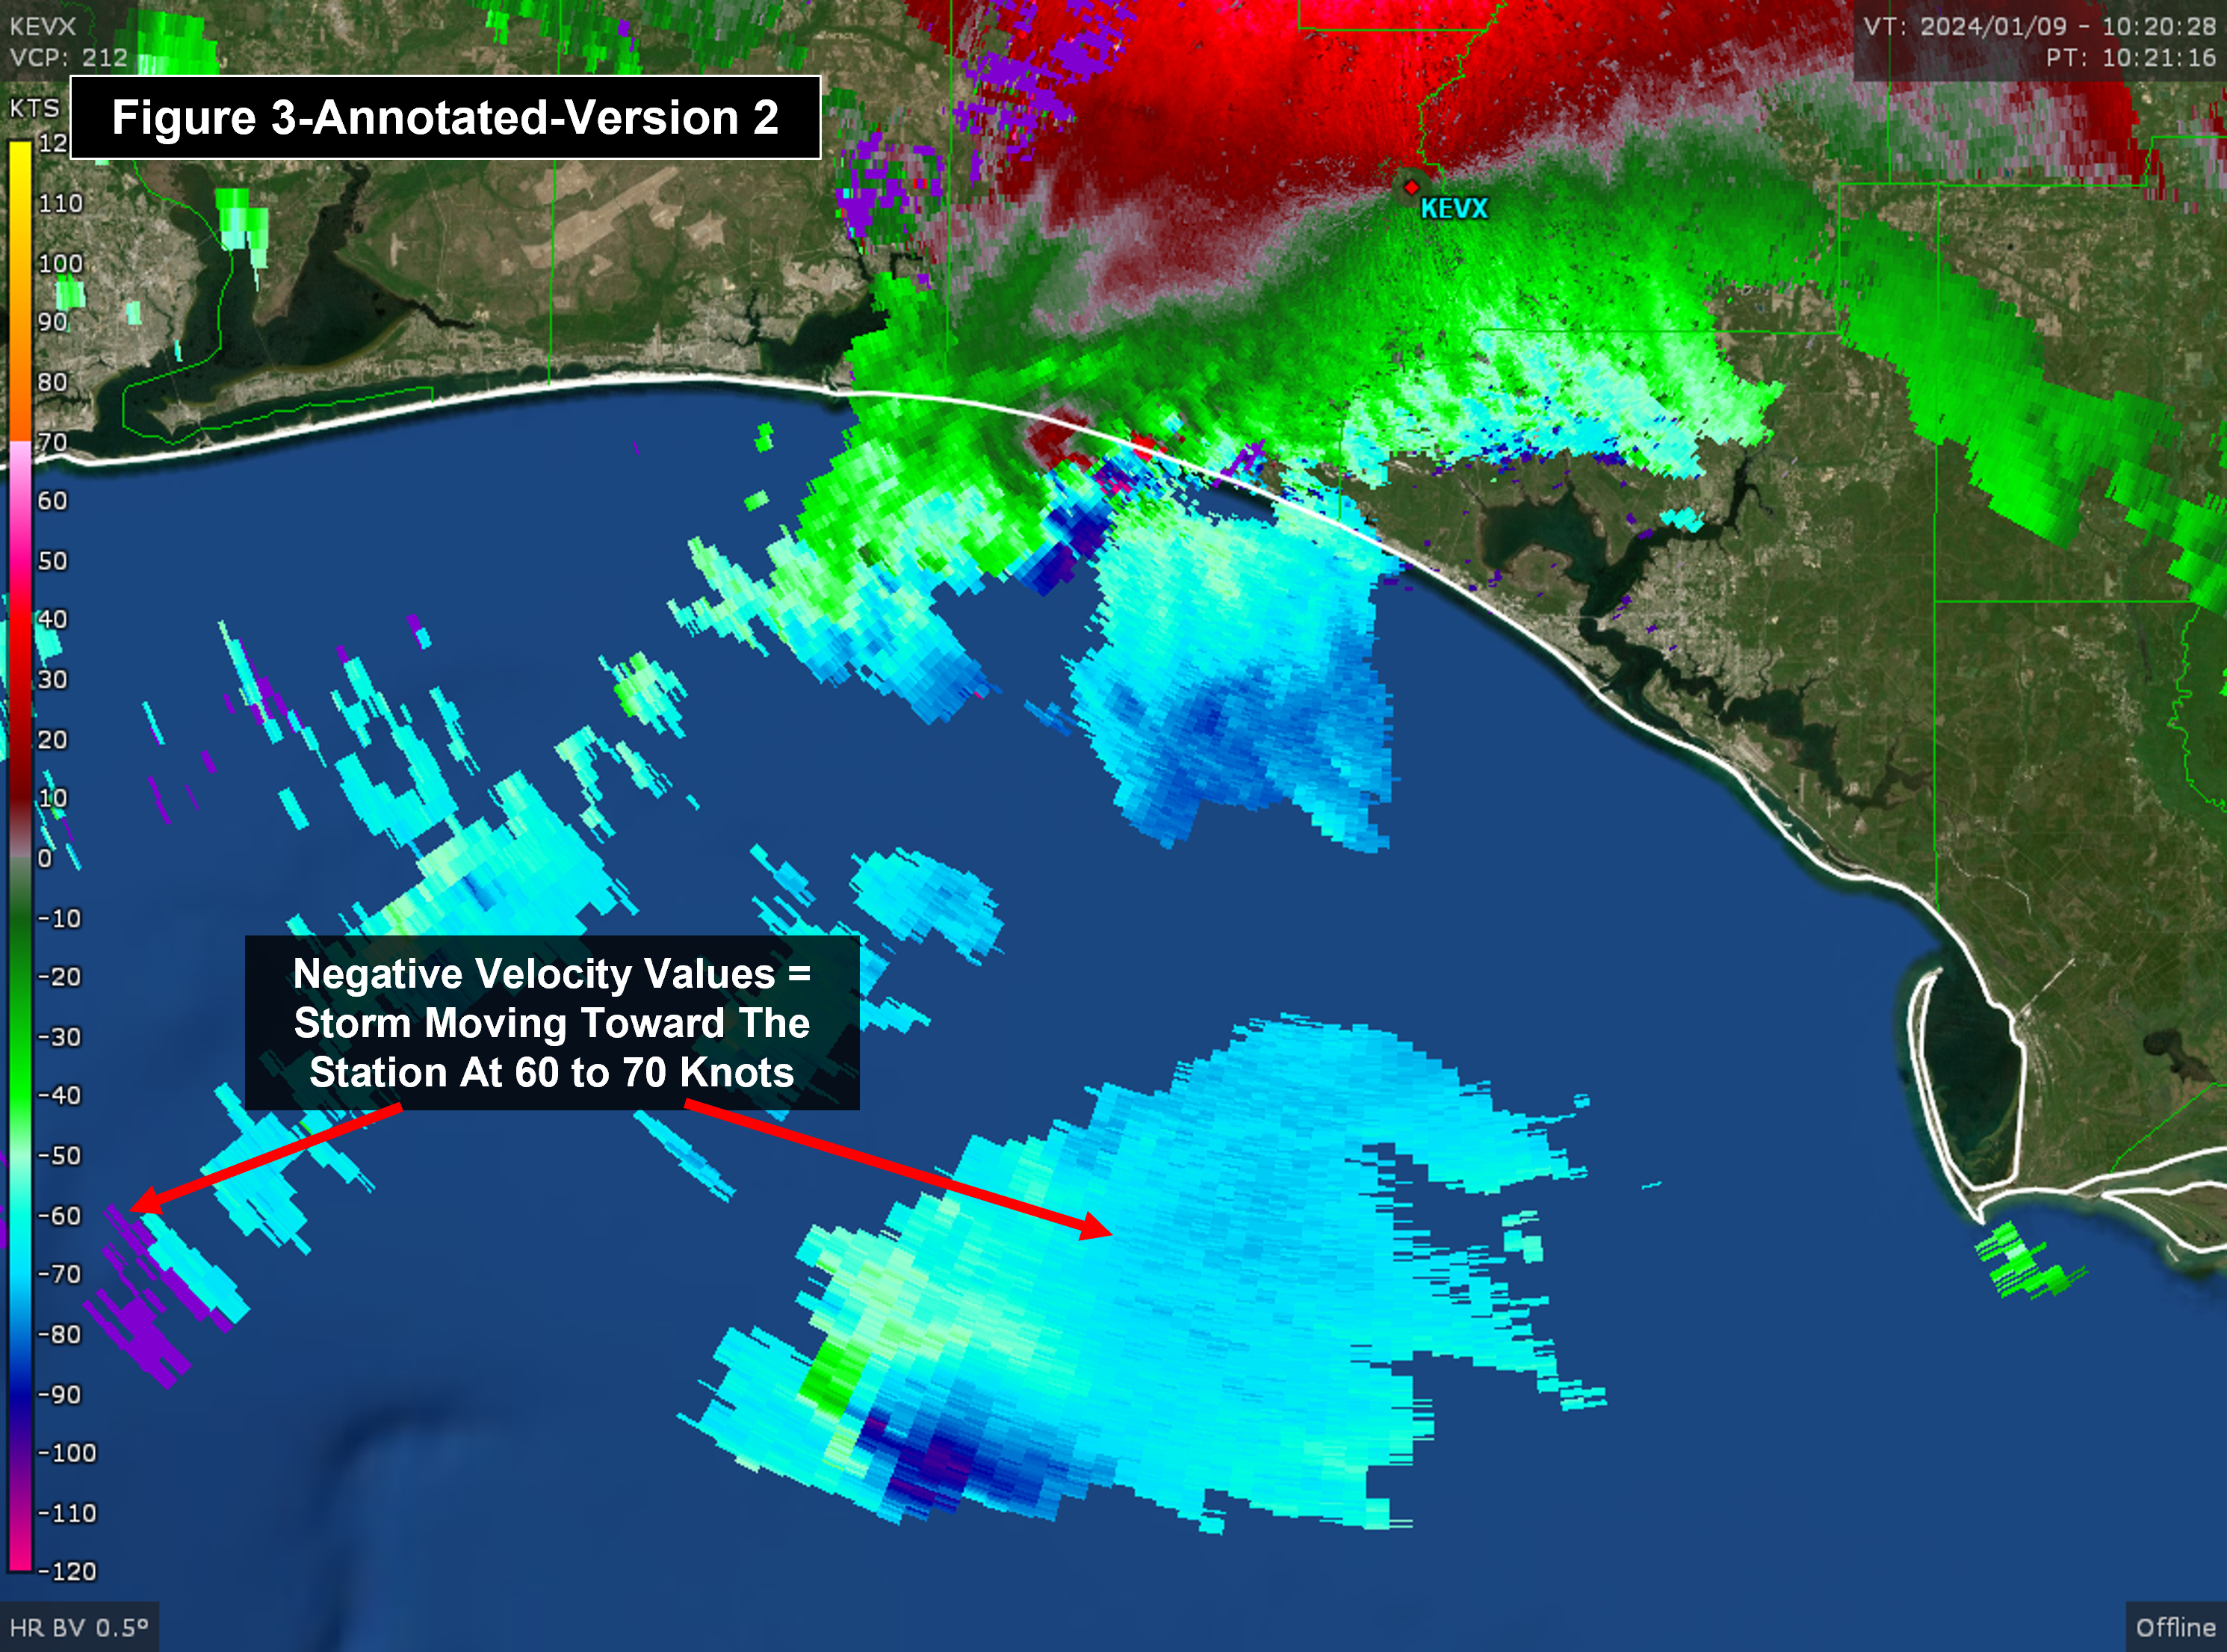
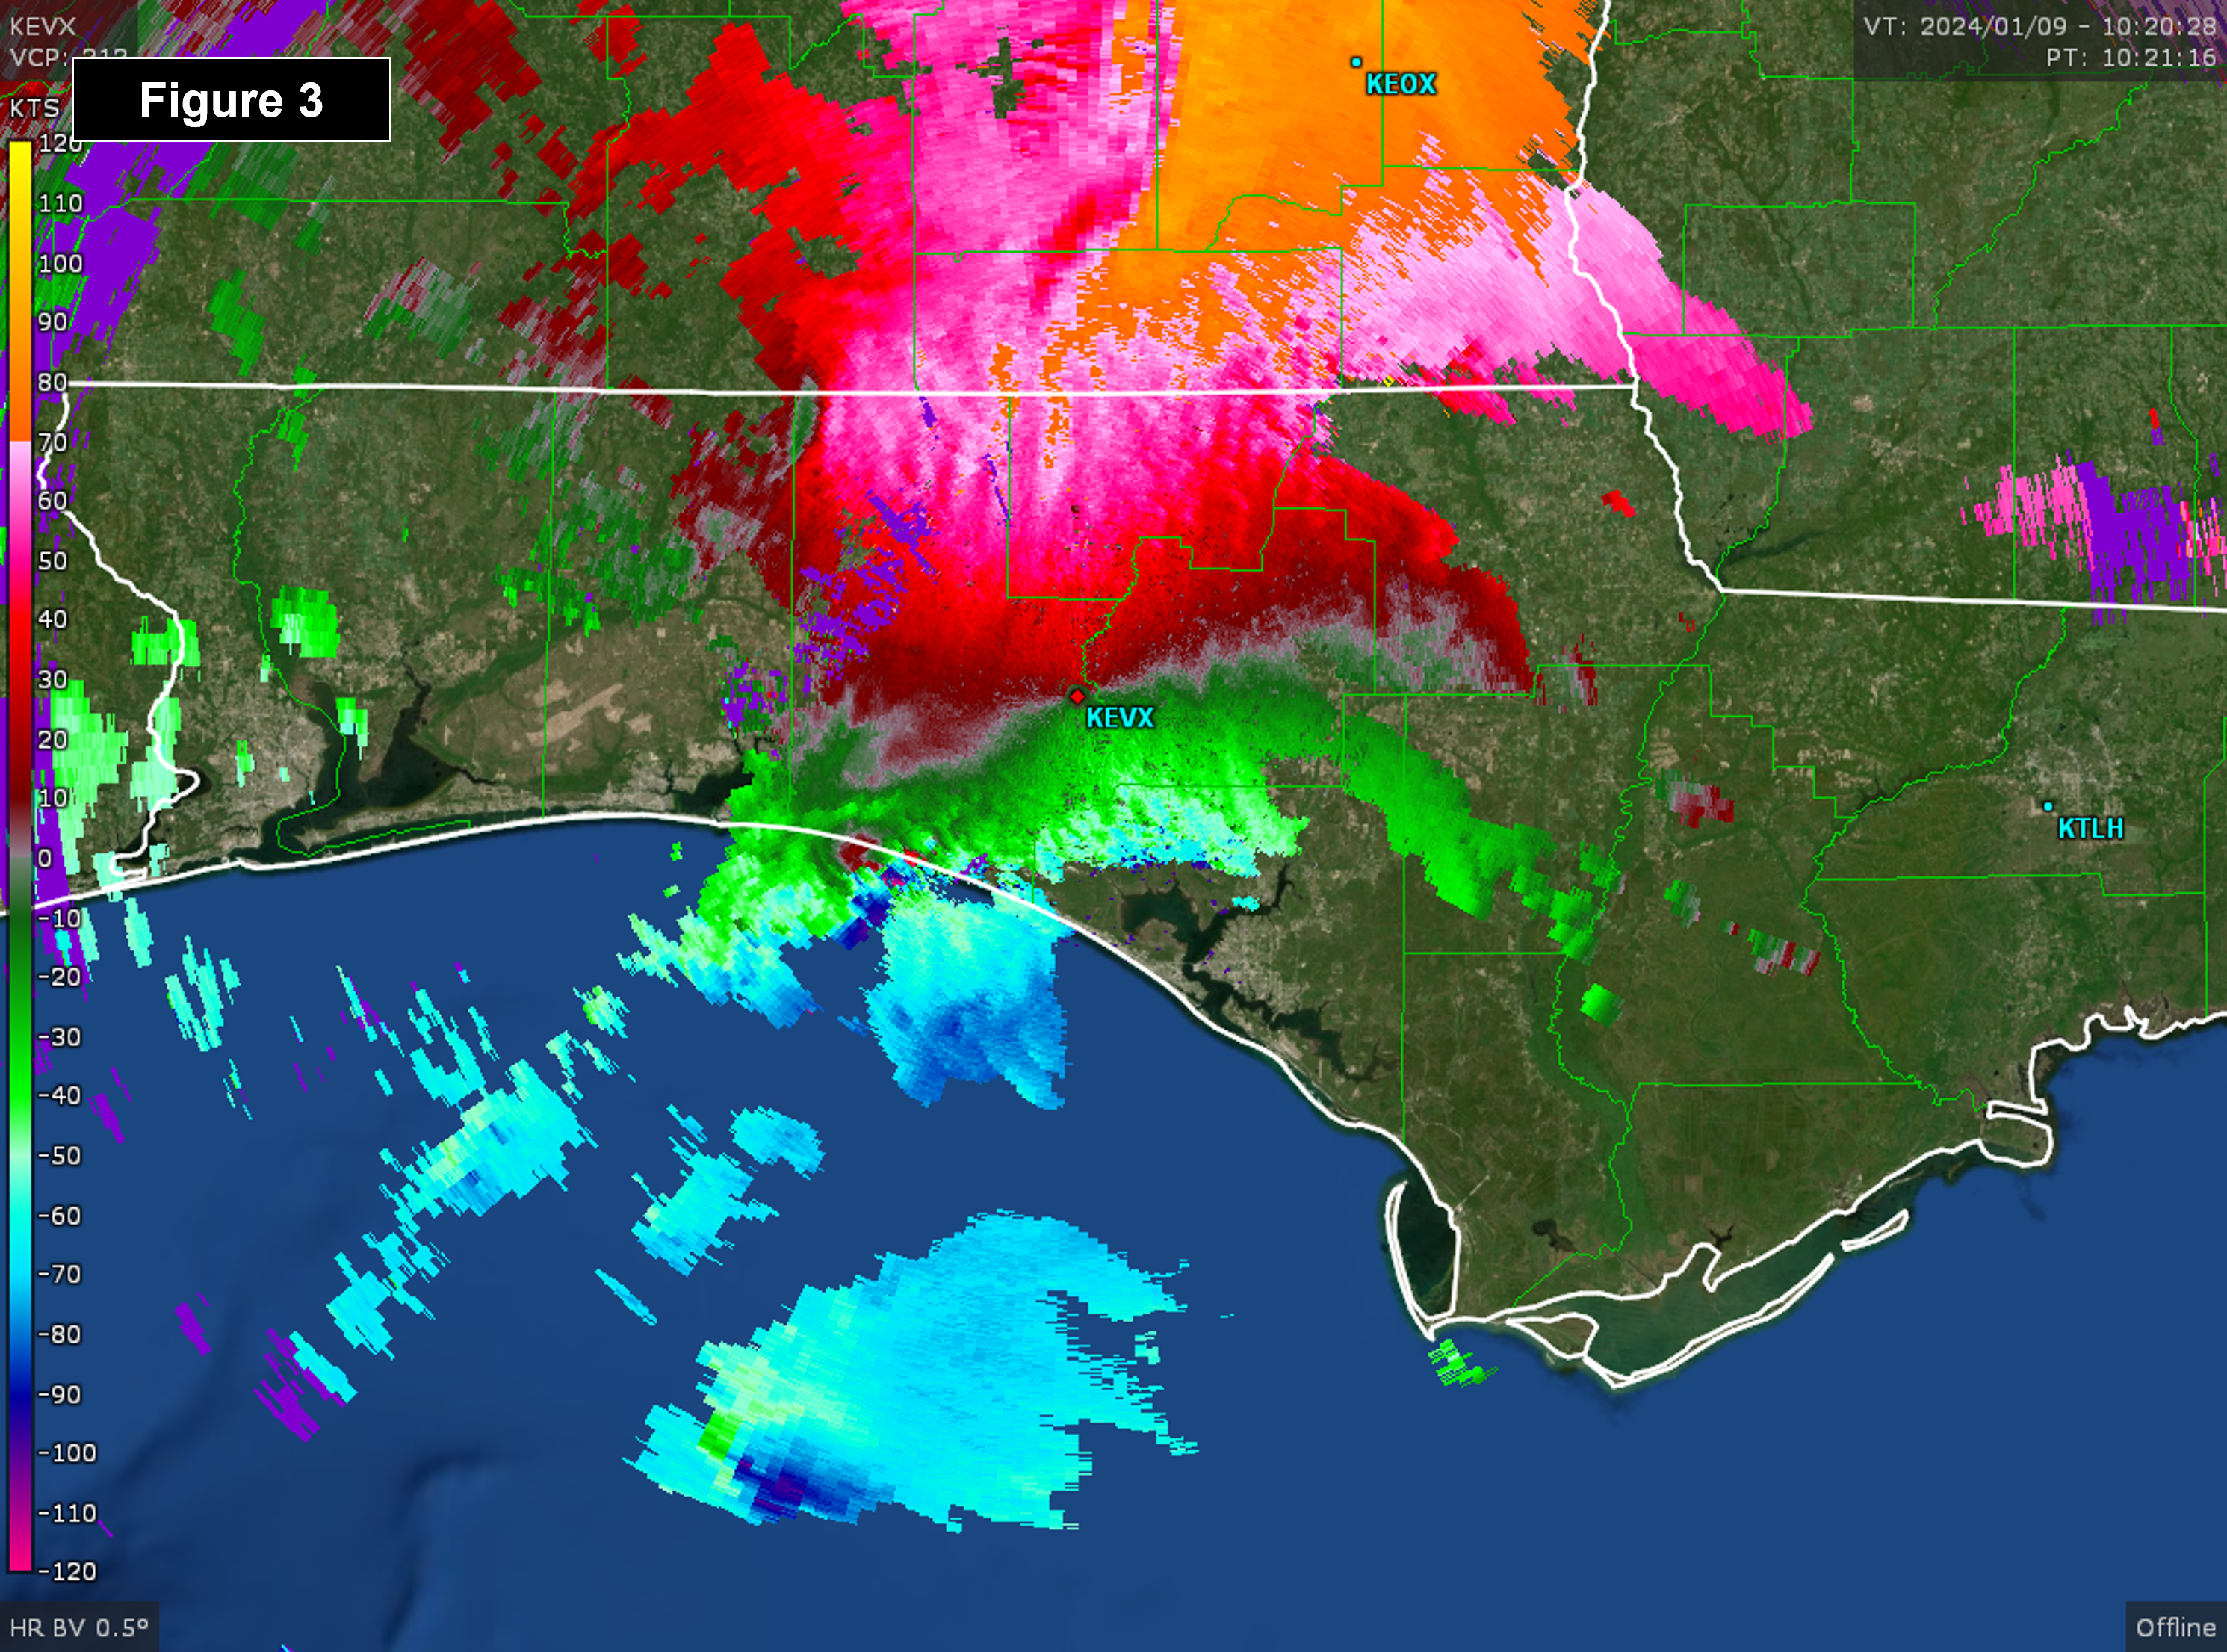 The base velocity image at 7:20 am on January 9, 2024 (figure 3) shows several strong thunderstorms near the Florida Gulf Coast. The storms south of the coast have negative velocity values and are therefore moving toward the station (labeled as KEVX in the center of the image) while the storms to the north have positive velocity values and are moving away from the station (click here for an annotated image). A comparison of the color shading on the large storm approaching the coast to the image’s legend indicates the storm was moving toward the station at 60 to 70 knots! (Click here for an annotated image.)
Storm-Relative Velocity Imagery
When severe weather threatens, forecasters keep a sharp eye for rotation within the storm that could indicate the presence of a tornado or waterspout. A special type of velocity imagery – storm relative velocity (SRV) – is designed specifically for this purpose. SRV imagery subtracts the overall motion of the storm from the velocity data to highlight areas of rotation. Rotation within a thunderstorm doesn’t necessarily mean that a tornado or waterspout is occurring, but that the storm may be capable of producing one.
 The storm-relative velocity image at 7:20 am on January 9, 2024 (figure 4) shows a large thunderstorm approaching the Florida coast. At the time of the image, the storm was the subject of a Special Marine Warning as the radar data suggested the possibility of a waterspout. The storm has the telltale signature of a waterspout — adjacent areas of positive velocity (outbound motion) and negative velocity (inbound motion) (click here for an annotated image). Adjacent outbound and inbound motion indicate areas of rotation and the possibility of a waterspout or tornado.
It will take a little practice to get comfortable using velocity imagery, but the effort will be very helpful the next time thunderstorms are approaching.