Introduction
Surface weather maps offer a wealth of information to the weather-savvy boater. However, the key to unlocking the vast treasure of information displayed on these maps is understanding the terminology and symbols used by forecasters to portray current and future weather patterns. In this first installment of a two-part series, I’ll introduce surface maps, some key terminology, meteorological time systems, and barometric pressure.
Types of Surface Maps
Surface weather maps come in two varieties — analyses and forecasts. These two types of maps are very similar in appearance but their purpose is quite different. Analyses show recent surface weather observations and features (Figure 1) and are published every three hours by NOAA’s Weather Prediction Center (WPC) (http://www.wpc.ncep.noaa.gov/). The observations used to prepare these analyses such as temperature, dew point, barometric pressure, and wind speed/direction, are collected by thousands of automated weather stations across the country. These stations, which comprise the Automated Surface Observing System (ASOS), are usually located at airports.

Figure 1
While analyses display past weather data, surface forecast maps (Figure 2) predict weather patterns at a specified time in the future. The same observational data used to create surface analysis maps also serves as the initial input for the computer models which guide the staff of the NWS in the production of their forecasts. There’s no point in letting good data go to waste!
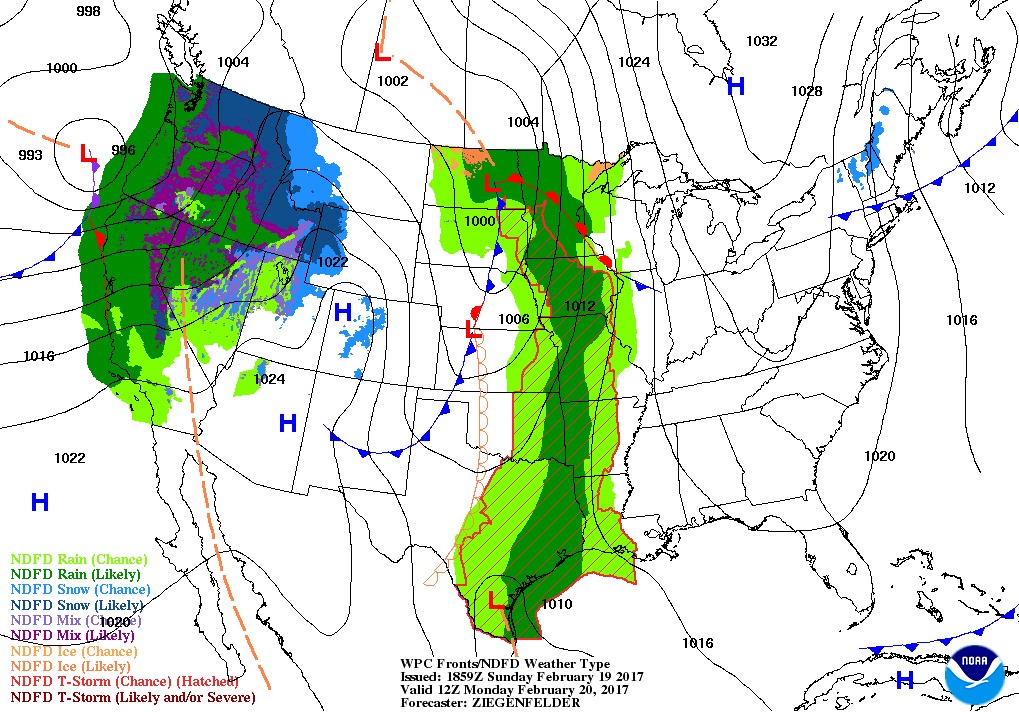
Figure 2
A Brief Moment About Time
In order to coordinate weather observation and forecasts, the world’s meteorological organizations, including the National Weather Service (NWS), publish their observation and forecasts using a timekeeping standard originally based on Greenwich Mean Time (GMT). This standard is known as Coordinated Universal Time (UTC) or Zulu (Z) and is a 24-hour system (not a time zone) based on the local time at Greenwich, England which is located on the prime meridian. For example, 1:00 am in Greenwich is 0100 UTC or 0100 Z, noon at Greenwich is 1200 UTC or 1200Z, and 5:00 pm at Greenwich is 1700 UTC or 1700 Z.
Although not exclusively, the NWS typically uses Zulu or “Z” on their text products and forecast graphics. To apply NWS forecast graphics to your area, you’ll need to convert from Zulu to your local time. The conversion is very easy once you know the time difference (time zone offset) between your location and Greenwich. If your boating occurs in the Eastern Time zone, you must subtract four hours from Zulu to arrive at your local time, while boaters in the Central Time zone need to subtract five hours. For example, 1200Z is 8:00 am Eastern and 7:00 am Central time. During the winter months when Daylight Saving Time is not in effect, an additional hour must be subtracted to convert to local time (1200Z is 7:00 am Eastern and 6:00 am Central). Table 1 offers several conversions from Zulu to local time for the Eastern and Central time zones of the United States.

Table 1
Issued and Valid – What’s the Difference?
The analyses and forecasts produced by the NWS contain the date and time the map was Issued, or published. In addition to the Issued information, NWS maps contain the Valid date and time. For a surface analysis, Valid indicates the date and time the observations were collected by the NWS observational network. For example, the surface analysis in Figure 1 was issued at 1928Z on Sunday, February 19, 2017 and displayed a variety of surface observations gathered at 1800Z on the same day.
Forecast maps display the predicted state of the atmosphere (barometric pressure, frontal boundaries, precipitation, etc.) at a specific date and time in the future. This future date and time is when the forecast is considered Valid. For example, the WPC surface forecast shown in Figure 2 was Valid at 12Z on Monday, February 20, 2017 or 7:00 am Eastern/6:00 am Central (Daylight Saving Time is not in effect). The forecast was Issued at 1859Z on Sunday, February 20, 2017 and is therefore a forecast for eighteen hours into the future.
Barometric Pressure
While our focus has been on surface weather patterns, the dynamics which produce weather occur within a deep layer of our atmosphere called the troposphere. The overall height of the troposphere varies by latitude, but on average it reaches approximately six miles above the Earth’s surface. The height of the troposphere over a location also varies with changes in the prevailing weather pattern.
The weight of the air molecules within this relatively thick layer exert a force on the surface which we know as barometric pressure. It may be a little counterintuitive, but a 1” by 1” column of air extending from the Earth’s surface to the top of troposphere weights nearly fifteen pounds and produces a barometric pressure reading of approximately 1013 millibars (mb) or 29.921 inches of mercury (inHg).
Barometric pressure observations are plotted on surface maps to help meteorologists identify highs, lows, and their associated features such as cold fronts, warm fronts, troughs, and ridges. While not specifically mentioned, the barometric pressure patterns plotted on NWS surface maps are shown in millibars and are always adjusted to sea-level.
Since barometric pressure is the weight of the air molecules above a particular location, the altitude of the weather station has a dramatic effect on barometric pressure observations. Imagine the perpetual low pressure system that would exist near Denver simply because the thickness of the troposphere is nearly 5,000 feet shorter due to the city’s lofty altitude. Adjusting pressure observations based on the altitude of the station eliminates this awkward situation and makes surface weather maps much easier to interpret.
Looking Ahead
In part two we’ll examine the symbols and meteorological shorthand used on surface weather maps.
Marine Weather Seminars
Boating requires many skills, but none is more important or challenging than understanding and predicting marine weather patterns. Whether you are a sailor or power boater, a marine weather seminar can make your journeys safer and more enjoyable by improving your ability to anticipate and avoid hazardous weather conditions. Click here for more information regarding my seminars and the current schedule.
