Calculating Convective Indices
As was mentioned earlier, skew-T diagrams are used to determine convective indices that mathematically quantify the potential for severe weather in an area. However, convective indices are a resource to point forecasters in the right direction, rather than sure-fire indicators of severe weather.
Lifted Index
The Lifted Index (LI) is a relatively simple parameter that reflects the difference in temperature at 500mb between the environment and a parcel that has been lifted moist adiabatically (by following the moist adiabat on a skew-T) from the Lifting Condensation Level (LCL). A negative LI indicates that the lifted parcel is warmer than its environment and positively buoyant. LI values below -5 suggest the possibility for strong convection, while values greater than 0 generally indicate that the risk of severe weather is minor.
|
|
|
Skew-T diagram from 12Z on February 16, 2006 from KLZK (Little Rock, Arkansas). Image from NCAR. |

The skew-T from 12Z (7 AM CST) on the 16th at Little Rock, Arkansas (above) has been annotated to show the method for calculating the Lifted Index. The purple line represents an air parcel lifted moist adiabatically from the LCL. The lifted parcel crosses the 500mb isobar to the left of the temperature sounding, indicating that it is colder than the environment and therefore negatively buoyant. The environmental temperature is approximately -14° C, while the lifted parcel is approximately -16° C. This method of manually calculating the LI correlates well to the LI value of 1.4 listed in the upper left corner of the diagram. Based upon a positive LI value, the atmosphere near Little Rock at this early hour was not supportive of severe weather.
Skew-T diagrams from NCAR also contain a hodograph in the upper left hand corner. Surface winds were generally southerly at a speed of 15 knots while at 200mb the winds were west-northwest at nearly 100 knots. Confirmation of the values on the hodograph can be obtained by observing the wind barbs along the right column of the diagram. At this hour, the atmosphere was quite stable but the air column above Little Rock was characterized by a significant amount of wind shear. One ingredient for the development of supercell thunderstorms was present.
 |
||
|
Skew-Ts from Little Rock, Arkansas from the University of Wyoming (roll mouse over times to change image) |
7AM CST 2/16 | 7PM CST 2/16 |
The above animation shows the transition in the air column near Little Rock in the twelve hours between 7 AM CST and 7 PM CST. The LI changed from 1.62 to -.85, representing a shift from a stable atmospheric profile to a very marginally unstable one.
When severe weather threatens, forecasters at the SPC use mesoscale analysis charts to examine the distribution of LI values across a region. The chart above from 20Z (2 PM CST) displays LI values along with Surface-based Convective Inhibition (SBCIN). SBCIN is a measure of the amount of energy (in joules per kilogram) required to raise an air parcel from the surface to the Level of Free Convection (LFC). Convective inhibition refers to that layer of a sounding where a lifted parcel is colder than its environment and negatively buoyant. On a skew-T diagram, SBCIN is the region below the LFC that is to the left of the temperature sounding and to the right of the dry adiabat associated with a surface parcel. This region of negative buoyancy must be overcome before storms can develop. Convective Inhibition (CIN), in the form of a temperature inversion (an elevated layer that is warmer than the layer below it) can be overcome by:
- heating of the air near the surface
- moistening of the air near the surface
- synoptic-scale lifting such as a cold-front or upper-level dynamics
|
|
| Surface-based Lifted Index (LI) and surface-based convective inhibition at 20Z (2 PM CST) on February 16, 2006 from the SPC. |
The chart shows pockets of LI ranging from -1 to -3, indicating moderately unstable air to the southeast of the approaching cold front. SBCIN values were low immediately in advance of the boundary and increased marginally to approximately 25 j/kg ahead of the frontal boundary. Negative buoyancy jumped dramatically, however, further to the southeast where values of SBCIN were near 100 (darker blue shading). The severe thunderstorms associated with the frontal boundary persisted for several hours after this analysis, indicating that forced ascent (in the form of the front and vort max) was sufficient to overcome this hindrance to deep convection.
Convective Available Potential Energy
Although a useful tool, the Lifted Index measures instability at only a single level (500mb) and therefore may not be representative of the convective potential of the atmosphere. Convective Available Potential Energy (CAPE) is the sum of the positive buoyant energy (in joules per kilogram) a rising surface parcel would possess as it travels from the Level of Free Convection to the Equilibrium Level. In contrast to the Lifted Index, CAPE provides an assessment of the convective potential through a deep layer of the atmosphere.
 |
||
|
Skew-Ts from Little Rock, Arkansas from the University of Wyoming (roll mouse over times to change image) |
7AM CST 2/16 | 7PM CST 2/16 |
CAPE is represented on a skew-T by the area to the right of environmental sounding and to the left of the sounding that results from raising a parcel moist adiabatically from the LFC. The animation above shows increasing instability in the air column near Little Rock in the twelve hours between 7 AM CST and 7 PM CST. At 7AM, a lifted parcel is colder than the environment through nearly the entire sounding and the value of CAPE was 0. Twelve hours later, CAPE had increased to 121.3 j/kg and represented a slightly unstable condition. It should also be noted that high values of CAPE do not guarantee the development of severe weather because a strong inversion may inhibit convection.
|
|
|
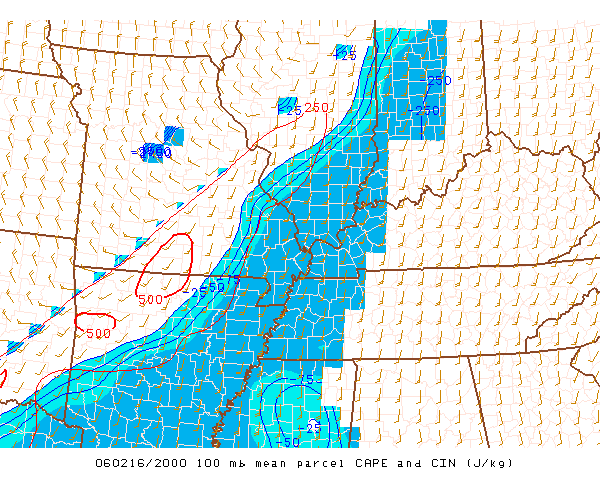
100mb MLCAPE and CIN at 20Z (2 PM CST) on February 16, 2006 from the SPC. |
The chart above from the SPC's Mesoscale Analysis site, presents the 100mb Mean Layer CAPE (MLCAPE) and Mean Layer CIN (MLCIN) at 20Z (2 PM CST) on the 16th. MLCAPE differs from surface-based CAPE in that the lifted parcel begins from an average of the dew point and temperature in the lowest 100mb. The values of MLCAPE are more realistic than surface-based CAPE when the air near the surface is very moist. A broad region of MLCAPE (outlined in red) of approximately 250 j/kg, with a couple of pockets in the 500 j/kg range, was in the path of the cold front. MLCAPE values in this range suggested a marginally unstable atmosphere.
Further ahead of the cold front was a region of relatively high MLCIN (25 to 100 j/kg), identified by blue shading. Although a hindrance to convection, this broad region of high MLCIN would prove to be no match for the lifting associated with the approaching cold front.
Next: Warning the Public
Previous: Analyzing Moisture
© 2005-2006 Mark A. Thornton