Analyzing The Large Scale Pattern: April 2011
Analysis At 300-mb
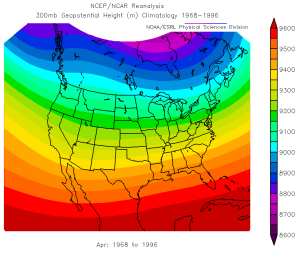
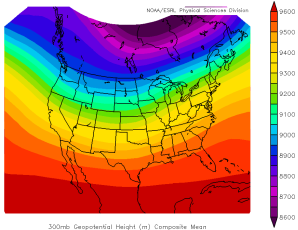
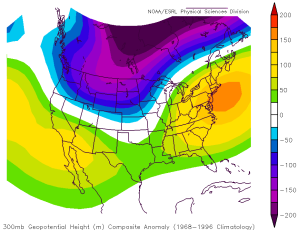
Our analysis of the synoptic pattern will begin with the upper atmosphere, specifically at 300-mb. Located at an average height of 9,000 meters (30,000 feet), 300-mb represents the typical altitude of the jet stream, a ribbon of fast moving westerly winds. The panel of three images above shows the long-term mean 300-mb heights for April (below, left), the mean 300-mb heights for April 2011 (below, middle) and the anomaly, or deviation, of the April 2011 300-mb heights from the long-term mean for the month. Although subtle, the mean 300-mb heights in April 2011 (below, middle) show a trough over the upper Great Plains that does not appear on the chart of the long-term mean. The analysis of 300-mb anomalies (below, right) shows that 300-mb heights were 25 to 175 meters below the long-term mean in the area of the trough.
Analysis at 300-mb |
||
 |
 |
 |
Mean 300-mb heights for the month of April -- 1968 to 1996.
(Larger Image) |
Mean 300-mb heights for April 2011 (Larger Image) |
300-mb height anomalies April 2011 to long-term mean.
(Larger Image) |
Analysis at 500-mb
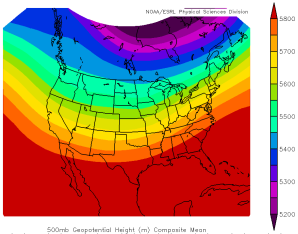
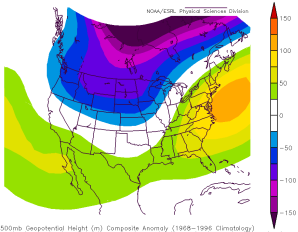
500-mb represents the mid-point of the six mile layer of the atmosphere we inhabit, and, on average, is located at a height of 5,500 meters (18,044 feet). The long-term mean 500-mb heights for April (below, left) shows a slight ridge over the northern Rockies and a corresponding trough over southern Ontario. The analysis of mean 500-mb heights (below, middle) shows a subtle trough over the upper Great Plains which is reinforced by the chart of 500-mb anomalies (below, right). Height anomalies for April 2011 ranged from -25 to -100 meters over this region.
Analysis at 500-mb |
||
 |
 |
 |
Mean 500-mb heights for the month of April -- 1968 to 1996.
(Larger Image) |
Mean 500-mb heights for April 2011 (Larger Image) |
500-mb height anomalies April 2011 to long-term mean.
(Larger Image) |
Analysis at 850-mb
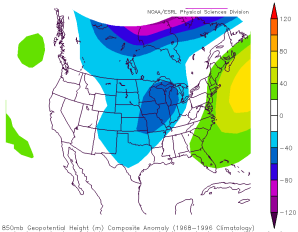
At an average height of 1,500 meters (4,900 feet), 850-mb is the lowest level above the surface that we'll examine. The long-term mean of 850-mb heights for April (below, left) shows a pronounced trough above the mid- and upper Great Plains. The chart of mean heights for April 2011 (below, middle) shows a trough is essentially located above the same general area, but it is more pronounced than the long-term mean. The chart of anomalies for April 2011 (below, right) clearly shows a broad area over the upper Midwest where the mean 850-mb height for April 2011 was 40 to 60 meters below the long-term mean.
Analysis at 850-mb |
||
 |
 |
 |
Mean 850-mb heights for the month of April -- 1968 to 1996.
(Larger Image) |
Mean 850-mb heights for April 2011 (Larger Image) |
850-mb height anomalies April 2011 to long-term mean.
(Larger Image) |
Analyzing The Impact At the Surface
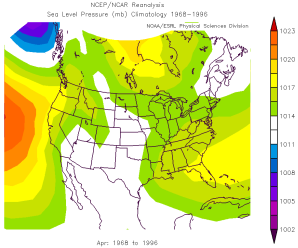
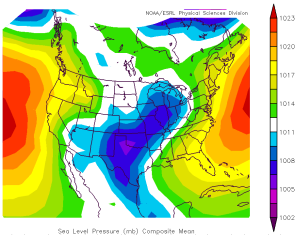
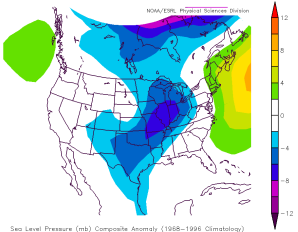
Mid- and upper-level troughs, such as those identified above, promote the development and guide the movement of surface low-pressure systems. The charts below show the long-term mean values of sea level pressure (left) for April, the mean sea level pressure values for April 2011 (middle) and the anomaly comparison of April 2011 to the long-term mean (right). The persistence of anomalously low upper air heights over the Great Plains during April 2011 contributed to a broad area of unusually low surface pressure to the east of the upper air troughs. The chart of April 2011 sea level pressure anomalies (right) indicates that the pressure was 4 to 8 millibars below the long-term mean during the month.
Analysis at the Surface |
||
 |
 |
 |
Mean sea level pressure for the month of April -- 1968 to 1996.
(Larger Image) |
Mean sea level pressure for April 2011 (Larger Image) |
Sea level pressure anomalies April 2011 to long-term mean.
(Larger Image) |
This area of below-normal pressure suggests the presence of surface low-pressure systems and their associated frontal boundaries. Frontal boundaries (cold, warm and stationary) mark the clash of air masses characterized by differences in moisture and temperature and are often a focal point for precipitation.
Cold fronts are often responsible for initiating thunderstorms that are capable of producing significant rainfall. Such was the case on April 4, 2011 (below, left) when a passing low-pressure system and associated cold front produced 1.3" of rain at Cleveland-Hopkins Airport. Thunderstorm activity often results in dramatically different precipitation totals over a region, which was the case on this date. While the airport received 1.3", Toledo and Erie received only .46" and .70" respectively.
 |
 |
 |
Surface Analysis at 18Z on April 4, 2011. Daily precipitation was 1.3" |
Surface Analysis at 18Z on April 19, 2011. Daily precipitation was .95" |
Surface Analysis at 18Z on April 25, 2011. Daily precipitation was 1.7"
|
Click here to view surface analysis charts for all of the days in April where precipitation was greater than .10"
Imagery courtesy of NOAA. |
||
The area near and north of a warm front often receives significant precipitation in the form of a steady, prolonged rain. On April 19, 2011 (above, middle) a warm front to the south of northern Ohio produced .95" of rain at Cleveland-Hopkins. The steady rain associated with this boundary persisted for nearly twelve hours.
Stationary boundaries are often overlooked, but they can serve to both initiate thunderstorms and provide a favorable environment for their movement. In this scenario, a series of storms pass repeatedly over the same area as they travel along the stationary boundary. Referred to as "training", this process can produce significant rainfall over a relatively long, but narrow area. A stationary boundary was draped across northern Ohio on April 25, 2011 (above, right) and consistently produced precipitation for the second half of the day and continued into April 26th. The boundary focused the precipitation into a narrow band with Cleveland-Hopkins receiving nearly four times more rain than Akron (1.7" versus .42").
A low-pressure system's ability to produce precipitation is dependent upon the amount of moisture that is available in the atmosphere, particularly low level moisture.
Transporting Moisture To Northern Ohio
Moisture that falls as rain in northern Ohio primarily originates from the Great Lakes, the Atlantic Ocean or the Gulf of Mexico and is delivered to our area by the wind. During April and May 2011, the persistent upper-air troughiness over the Plains combined with the counterclockwise winds circling surface low-pressure systems promoted stronger than normal southwesterly winds from the Gulf of Mexico into the Ohio Valley.
850-mb Vector Winds |
||
 |
 |
 |
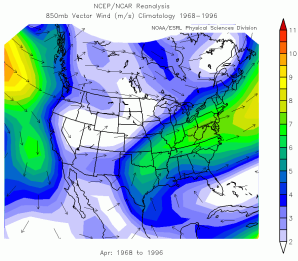
Mean 850-mb vector wind for the month of April -- 1968 to 1996. (Larger Image) |
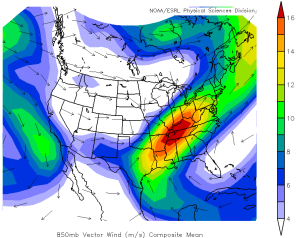
Mean 850-mb vector wind for April 2011 (Larger Image) |
Mean 850-mb vector wind anomalies April 2011 to long-term mean. (Larger Image) |
In order to assess a deeper layer of wind and moisture transport, meteorologists examine vector winds (speed and direction) at 850-mb (1,500 m / 4,900'). During April 2011, the winds at this height were particularly strong. The chart of long-term mean 850-mb winds for April (above, left) shows southwesterly winds flowing from the Gulf of Mexico into Ohio at the rate of 5 to 7 meters per second (m/s) or 11 to 16 miles per hour (mph). The mean 850-mb vector wind for April 2011 (above, middle) remained southwesterly from the Gulf of Mexico, but values were in the range of 13 to 16 m/s (29 to 36 mph). As shown in the chart of mean 850-mb vector wind anomalies (above, right), wind speeds during April 2011 were more than twice the long-term mean.
Measuring The Increased Moisture
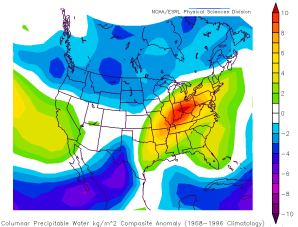
The markedly stronger winds low-level winds during April transported copious amounts of moisture into Ohio. One parameter used to measure atmospheric moisture content is precipitable water, the volume of water vapor in a column of air extending from the surface to 300-mb (9,000 m/30,000'). The long-term mean of precipitable water during April (above, left) in Ohio is approximately 16 kg/mˆ2. The mean precipitable water values in April 2011 (above, middle) over northern Ohio were in the range of 22.5 to 25 kg/mˆ2 -- nearly 150% of the long-term mean. This increase in precipitable water over northern Ohio was at the northern extent of a tongue of enhanced moisture extending all the way back to the Gulf of Mexico.
Precipitable Water |
||
 |
 |
 |
Mean precipitable water for the month of April -- 1968 to 1996. (Larger Image) |
Mean precipitable water for April 2011 (Larger Image) |
Mean precipitable water anomalies April 2011 to long-term mean. (Larger Image) |
Precipitable water is a measurement of moisture content, not a resource that can be used to predict the liklihood of rain. In addition, high precipitable water values don't result in significant rainfall when the overall atmospheric dynamics are weak or absent. However, research studies have concluded that precipitable water values that are => 150% of the long-term mean are correlated with flooding. This threshold was met or exceeded over a large region parallel to the Ohio River valley and extending into northern Ohio.
A complete collection of the 300-mb, 500-mb, 850-mb and surface charts for all days in April 2011 where the total precipitation at Cleveland-Hopkins Airport was at least .10" can be found here.
Summary
Record rainfall was observed at Cleveland-Hopkins Airport and much of northern Ohio during April 2011. This extreme rainfall was the result of a very supportive and persistent large-scale weather pattern far to the west of the state. This pattern primed the atmosphere over northern Ohio by transporting an unusually high amount of fuel -- in the form of low-level moisture -- northward from the Gulf of Mexico. This low-level moisture was transformed into rainfall by a series of surface low-pressure systems (and associated frontal boundaries) that formed in the favorable environment to the east of the stronger than normal upper-level troughs and then traveled across our area.
Note: All mean and anomaly imagery courtesy of the Earth Systems Laboratory.