WILMA MAKES HISTORY
Once a hurricane forms, the NHC focuses its attention on forecasting the storm's track and future intensity. The accuracy of track forecasts has improved dramatically over the past several years but the NHC's ability to accurately predict a storm's intensity has lagged behind. Wilma grew from a tropical storm to the most intense hurricane in recorded history in only twenty-four hours. While intensification was mentioned in the NHC's advisories on October 18th, Wilma's rapid and extreme development came as a surprise to the NHC.
Most tropical systems exist far from land, preventing meteorologists from directly measuring the atmospheric and oceanic conditions that effect their development. Fortunately, a variety of resources are available that allow them to indirectly analyze the development of tropical systems and the mechanisms that steer them. For example, instrument packages on board weather satellites provide a steady stream of useful atmospheric data from remote geographic areas that might otherwise be unattainable. In addition to the data obtained from remote sensing technology, meteorologists have access to information captured by ocean buoys, terrestrial radar stations, and flights of the intrepid "hurricane hunters".
A Tropical Storm Is Upgraded
Wilma was upgraded to a hurricane on the morning
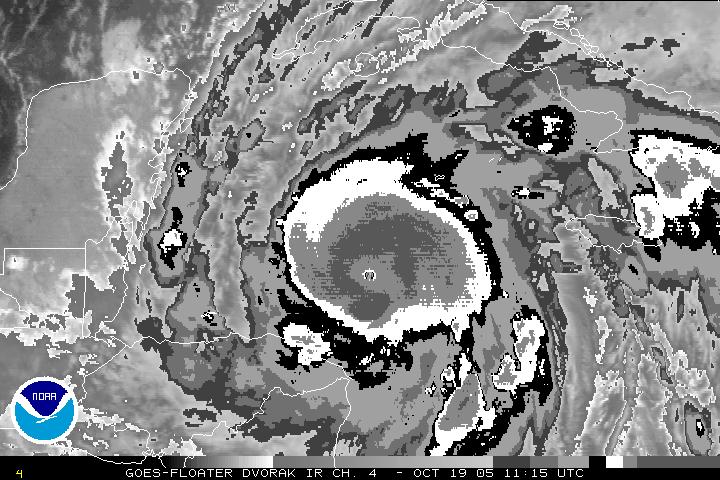
of October 18th based upon the subjective Dvorak technique, a method of
classifying hurricanes by interpreting the storm's associated cloud patterns on
enhanced infrared and/or visible satellite images (such as the one below from
the morning of October 19). To the trained eye, cloud patterns are an excellent
indicator of cyclone intensity and development and can be used derive a Dvorak
Current Intensity Number for a storm.
|
||
Dvorak infrared satellite image taken at 7:10am on October 19, 2005. Wilma was near its maximum intensity at the time. Image from NOAA Satellite and Information Service. |
||
In addition to the subjective Dvorak technique, scientists also have access to the output from the objective Dvorak Technique. Instead of solely relying upon a meteorologist's interpretation of cloud patterns, the objective Dvorak technique uses a computer program to analyze digital infrared information. Since it is rendered by a computer, the Current Intensity Number from the objective Dvorak technique is more consistent, particularly when several forecast centers are monitoring the same cyclone.
An Historic Twenty-four Hours
During the twenty-four period concluding at 8am on
October 19, Hurricane Wilma would undergo a transformation that would secure its
place in history. On the morning of the 18th, Wilma, barely a hurricane, was
packing winds of 65 knots and a central pressure of 980 mb. By 8am on the 19th,
Wilma was the most powerful Category 5 Atlantic hurricane in history, with winds
of 150 knots and a central pressure of 882mb--a decrease of 95mb in a single
day. Even more breathtaking was the 88mb decline that occurred in the fifteen
hours between 5pm on the 18th and 8am on the 19th. The NHC predicted "a high
likelihood of rapid strengthening", early on the 18th, but nothing of the
magnitude that Wilma would experience.
|
||
Comparison of the GFDL forecast for barometric pressure from 18Z (2pm) on October 18th through 18Z (2pm) on October 19th. The model failed to "see" the conditions that would contribute to Wilma's rapid intensification. GFDL progs obtained from the Penn State Ewall. Wilma's pressure readings obtained from NHC discussions. |
||

One computer program used by the NHC to predict hurricane intensity is the Geophysical Fluid Dynamics Laboratory (GFDL) model. Using the GFDL run initialized at 2am on October 18, the graph above compares the model's prediction for sea level pressure for October 19 and 20 to Wilma's actual readings. The model clearly missed the dramatic decline that occurred early on the 19th.
Wilma's rapidly declining barometric pressure and intense winds were confirmed in the wee hours of October 19th by aircraft reconnaissance. These "flying weather stations" have trained meteorologists and a wealth of sophisticated instruments on board that allow for both direct and inferred determination of storm features as the aircraft passes through the center of the cyclone. The meteorological information collected, such as the location of the hurricane, various temperature measurements, wind speeds, sea level pressure and the character and orientation of the eye, is transmitted real-time in short bursts of data called a vortex messages. Once decoded, meteorologists at the NHC are able to compare this on-the-spot data with other, more remote forms of observation to help them produce their forecasts, advisories and associated warnings.
|
Visible satellite images of Wilma's eye from 1:45pm on October 19th (left) and 1:45pm on October 21st (right) (full image). By the 21st, Wilma had declined to a Category 4 with a central pressure of 926mb. |

The size of a hurricane's eye provides information concerning the storm's strength, with small eye diameters generally associated with strong storms. The NHC noted late on October 18th that Wilma "has developed the dreaded pinhole eye", referring to the storm's extremely small center of circulation. During an aircraft reconnaissance mission on the 18th, the diameter of Wilma's eye was measured at 4 nautical miles. Although an eye this small is extremely rare and indicative of Wilma's tremendous intensity, the flight at 2:11am on the 19th reported an eye that was just 2 miles wide.
Eye-wall contraction is the term used to describe the decrease in the diameter of a hurricane's eye, and is a clear indicator of an increase in the storm's intensity. Concurrent with the contraction of the eye wall is a marked increase in wind speed.
The two visible satellite images above offer a comparison of Wilma's eye in the early afternoon hours of October 19th (left) and October 21st (right). Aircraft reconnaissance further confirmed that at the time of the visible image on October 19th, Wilma was an intense Category 5 storm, with a central pressure of 900mb and an eye diameter of 4 nautical miles. Two days later on the 21st, Wilma had weakened slightly to Category 4, had a central pressure of 926mb and an eye diameter of 30 nautical miles.
As Wilma intensified, the cyclonic flow of warm, moist air into its base increases in response to falling barometric pressure. As we learned earlier, it is this moist air that provides the storm's fuel. If the convergence of moist air at the surface is not offset by another mechanism, the weight of the air column would increase, surface barometric pressure would rise and the hurricane would begin to deteriorate. The offsetting mechanism that is responsible for exhausting a hurricane is referred to as outflow or divergence and occurs at the upper levels of the storm.
|
Tropical cyclone structure from Jetstream: An Online Weather School (NOAA). annoted to show the anticylonic outflow (divergence) in the upper levels of the storm. |

Due to the dynamics discussed in the previous section, winds spiraling upward within the eyewall tend to move outward as altitude increases. As this air exits the top of the hurricane, it exhibits a clockwise flow (anticyclonic) which transports its outward away from the system's circulation. It is not uncommon for this anticyclonic flow to reach speeds of 100 mph, forming a feature called an outflow cirrus jet. An intensifying hurricane such as Wilma would have had a very healthy outflow on October 18th.
|
Chart of upper-level (150mb to 300mb divergence) from CIMSS at 8am on October 20, 2005 (full image). The bullseye marks the health divergence associated with Wilma. |

Charts, such as the one above from 8am on October 20, 2005, measure the magnitude of divergence at the upper levels of the atmosphere. Although the chart was prepared on the day after Wilma's dramatic intensification, it clearly shows a bullseye of divergence over Wilma.